Sending us your consumption data
Your metered electricity consumption is the single most useful thing you can send us. It comes from Elering's Estfeed portal, it is yours to export, and it takes about five minutes. You will end up with two CSV files — 2026 and 2025 — to email back to us.
The portal opens in Estonian but has a full English interface. The first step switches it over, and every label after that is given in bold exactly as it appears on screen.
Red arrows in the screenshots mark what to click. The name and company shown are placeholders, and the black bars cover our own meter readings — your screen will show yours.
- 01
Switch the portal to English
Open estfeed.elering.ee. The portal opens in Estonian, so before anything else find Language in the top bar and change it to English. Every label below then matches what you see.
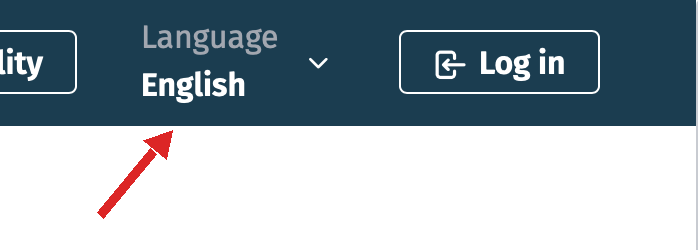
Do this before logging in. If the interface comes back in Estonian after you authenticate, use the same dropdown again.
- 02
Log in
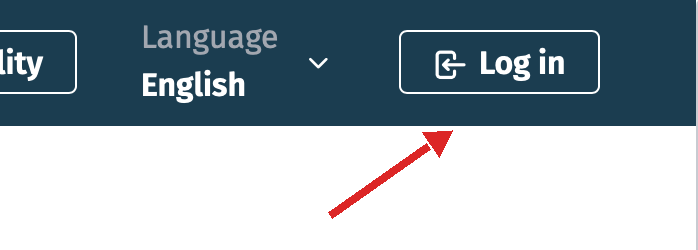
Click Log in in the top right and authenticate with ID-card, Mobile-ID or Smart-ID.
- 03
Select the company
Click your name in the top right — a dropdown opens listing the companies you can act for. Pick the one that holds the building.
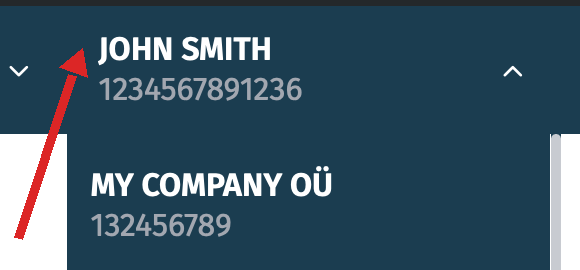
If the company is not listed, you do not hold representation rights for it in the business register. Someone who does will need to run the export instead — it cannot be worked around from your own account.
- 04
Open the consumption view
You land on My Metering Points. Click the blue Electricity consumption box on the upper right, or My Consumption in the left sidebar. Either opens the same page.
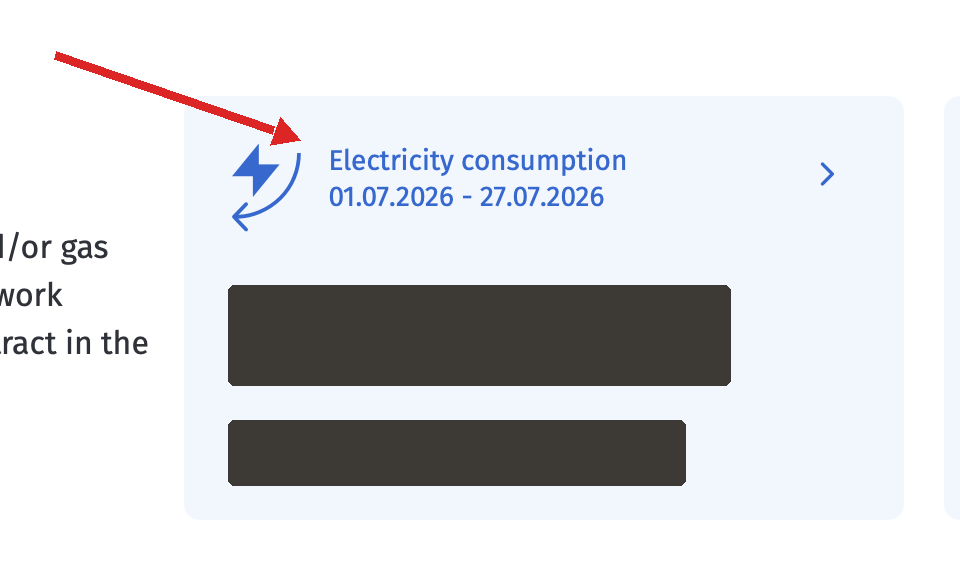
This step can take a while. The page pulls a full year of readings and shows a loading indicator while it works. Let the graph finish drawing before you touch anything else — the export is not ready until it has.
- 05
Set up the export
Four selections on the filter bar, then wait for the chart to draw.

- Metering points
- All of them. Several metering points export into one file as separate columns, so there is no need to repeat this per point.
- Period
- Year — the Year button, not Day, Week, Month or Custom.
- Year
- 2026
- Resolution
- 15 min
Changing any of the four redraws the graph, and a year at 15-minute resolution is around 35 000 points — so expect the wait again. Do not click Download while it is still loading; you will get nothing or a partial file.
- 06
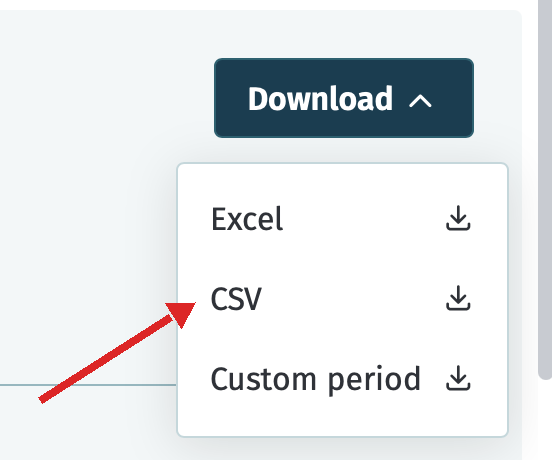
Download the CSV
Click Download above the chart on the right, then choose CSV.
- 07
Repeat for 2025
Go back to the Year field and select 2025, either with the < arrow beside it or via the calendar icon. Check the resolution is still 15 min, let the chart load, and download again.
If 2025 cannot be selected, the metering point had no active grid contract that far back. Send whatever exists — a partial history is still useful.
What to send
Two CSV files at 15-minute resolution, one for 2026 and one for 2025. No processing needed at your end — send them exactly as they download.
Why we ask for it
- Sizing
- Your electrical load profile tells us how much headroom the connection actually has, hour by hour, rather than what the fuse rating suggests.
- Modelling
- Fifteen-minute data shows us the shape of your demand across a full year — including the summer months that decide whether a heat node earns twelve months or five.
- An honest answer
- It is what lets us tell you the numbers do not work, if they do not, before either of us spends time on a site visit.
We use the data to assess your building and nothing else. It is not shared outside HeatLoop, and if you decide against the project you can ask us to delete it.
Send the files over
Attach both CSV files and tell us which building they belong to. If something in the export did not work, say what you got stuck on — we will sort it out.
- Building address
- Consumption CSV, 2026
- Consumption CSV, 2025
- How the building is heated today
info@heatloop.com